

































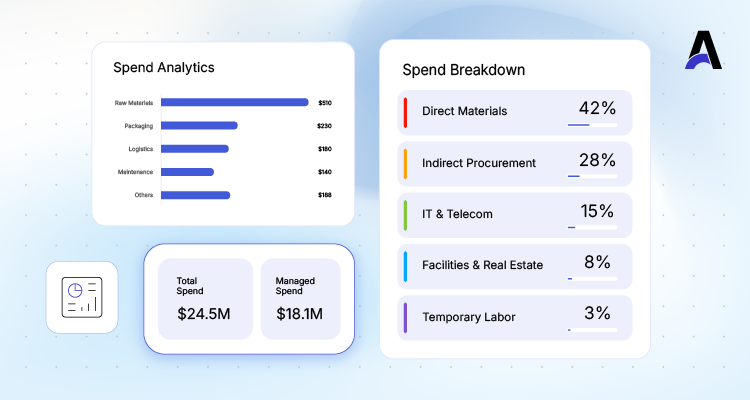
MRO (maintenance, repair and operations) spend analysis is the process of collecting, cleaning, classifying and analysing MRO purchases to identify duplicate items, price variance, supplier fragmentation, off-contract buying and avoidable emergency orders. It turns fragmented plant-level purchasing data into a structured view of where money is being spent, where value is leaking and which opportunities can be acted on safely. It works best as part of an ongoing spend analytics process rather than a one-time spreadsheet exercise. This guide is for procurement heads, category managers and plant finance leaders who need a practical method for finding savings in maintenance spend without putting uptime at risk.
Key Takeaways
What Is MRO Spend Analysis?
MRO spend analysis is the structured review of spend on maintenance, repair and operations items, such as spare parts, bearings, fasteners, electricals, lubricants, tools, safety equipment and consumables, to find savings, reduce risk and improve control. It answers four questions: what is being bought, from whom, at what price, and under which contract or approval.
The category is different from direct materials. MRO items are bought in small quantities, by many people, across many sites, and often in a hurry. That is why the discipline is closely linked to MRO procurement and MRO spend management: analysis creates the baseline, and procurement and management practices then act on it.
Why Is MRO Spend So Hard to Analyse?
MRO spend is hard to analyse because the data is fragmented, descriptions are inconsistent and the purchases are individually small. Each of these problems hides savings in a different way.
- Plant-level material masters. Each plant or business unit often creates its own item codes, so one part can exist under several numbers.
- Free-text and non-catalog buying. Urgent requests are often raised as free-text lines, which break classification.
- Long-tail volume. Thousands of low-value lines add up to a large total, yet no single line attracts management attention.
- Emergency pressure. When a line stops, buyers choose speed over price, supplier choice and contract terms.
The pressure to buy fast is real. The Siemens True Cost of Downtime 2024 report states that the world's 500 biggest companies lose almost $1.4 trillion annually through unplanned downtime, equivalent to 11% of their revenues. The study draws on 181 interviews covering April 2019 to March 2023 and covers all causes of downtime, not only missing spares. It still explains why plants protect availability first and price second.
How Do You Run an MRO Spend Analysis? Six Steps
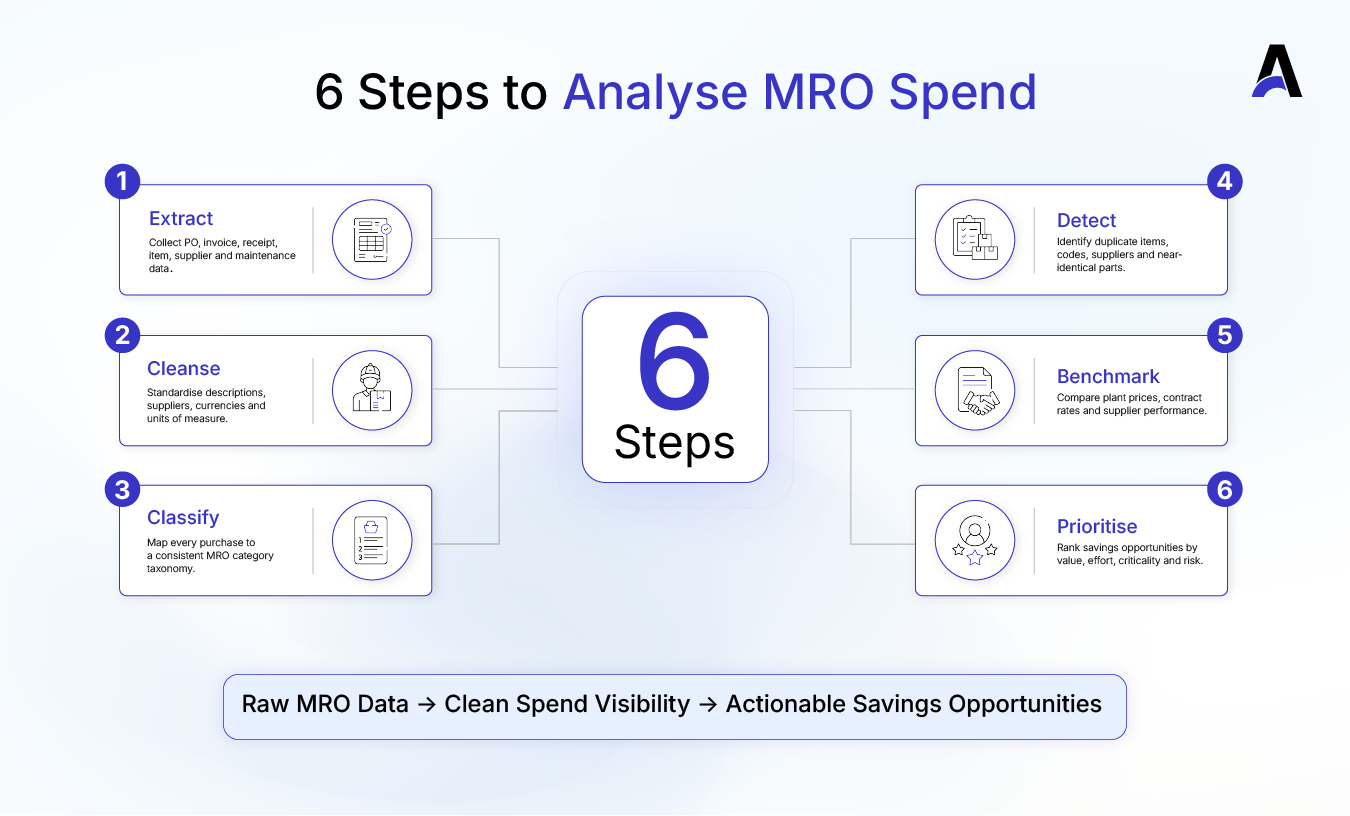
Step 1: Extract data from every source
Pull 12 to 24 months of purchase order lines, invoice lines and goods receipts from every ERP instance, along with the item master, supplier master, cost centre and plant fields. Add contract prices, catalog data and any maintenance system records of parts consumption. Include free-text lines and card or petty-cash purchases, because they carry the least control.
Step 2: Cleanse and normalise
Standardise units of measure, currencies, supplier names and descriptions. Merge supplier records that represent one legal entity. Expand abbreviations so that "BRG 6205 2RS" and "ball bearing, sealed, 25 x 52 x 15 mm" can be compared. This step is dull and decisive.
Step 3: Classify against a taxonomy
Map every line to a category structure that procurement, maintenance and finance all accept. The next section explains how to design it.
Step 4: Detect duplicate and near-duplicate items
Group items by manufacturer part number, key attributes and normalised description. Flag cases where the same item has several codes, different suppliers or different prices. McKinsey describes a truck producer that used machine learning to compare similar parts and identified more than 1,000 parts for elimination, with savings potential above EUR 20 million. That case concerns vehicle parts, not MRO, but it shows what part similarity analysis can find at scale.
Step 5: Benchmark price and supplier performance
Compare what each plant paid for the same item, compare paid prices with contracted prices, and compare delivery performance by supplier. Price variance is usually the fastest source of evidence for a business case.
Step 6: Size and prioritise the opportunity
Convert findings into a ranked list by value, effort and risk. Remove items that are critical or have long lead times from aggressive price actions until availability risk is understood.
How Should You Design an MRO Spend Taxonomy?
A spend taxonomy is a hierarchical classification scheme that assigns every purchased item to a category, so spend can be grouped, compared and owned. For MRO, the most effective design combines a recognised external classification standard with an internal structure that reflects how maintenance and sourcing teams actually work.
UNSPSC is widely used to classify products and services across a consistent hierarchy, with core levels covering segment, family, class and commodity. Using a common standard can improve classification consistency across plants, ERP instances and suppliers, while an internal category structure adds the sourcing ownership, asset context and criticality needed for MRO decisions.
A standard alone is rarely enough, because it says little about criticality, consumption or asset context. A layered design closes that gap.
| Taxonomy layer | Purpose | Example |
|---|---|---|
| External standard code (such as UNSPSC) | Consistent categories for benchmarking and reporting across plants and ERPs | Bearings grouped under one commodity class, regardless of site description |
| Internal category tree | Sourcing ownership and supplier strategy | Rotating equipment, fasteners, electricals, lubricants, safety items |
| Item attributes | Duplicate detection and specification standardisation | Manufacturer part number, size, material, rating, sealing type |
| Usage and criticality tags | Separating consumables from critical and long-lead spares | Consumable, insurance spare, repairable, critical to line |
| Plant and asset context | Understanding demand and standardising across sites | Plant, asset class, maintenance order type (planned or breakdown) |
Keep the structure stable once agreed. A taxonomy that changes every quarter makes trend analysis meaningless. Assign an owner, usually a category manager with a maintenance counterpart, to approve new codes and review exceptions.
Where Do MRO Savings Actually Come From?
The five main MRO savings levers are price harmonisation, supplier consolidation, contract and catalog compliance, specification standardisation and inventory right-sizing. MRO spend analysis identifies where each lever can create value without increasing availability or operational risk.
| Lever | What the analysis shows | Action | Watch-out |
|---|---|---|---|
| Price harmonisation | Same item bought at different prices across plants or suppliers | Move to the best qualified price through shared agreements | Check brand, pack size and delivery terms before comparing |
| Supplier consolidation | Many suppliers for one category, each with small volume | Award category bundles through a competitive event | Keep a backup source for critical items |
| Contract and catalog compliance | Purchases made outside agreed prices or approved suppliers | Route routine items through contract-linked catalogs | Catalog content must stay current or users bypass it |
| Specification standardisation | Several near-identical items serving one purpose | Retire duplicates and agree a preferred item | Involve maintenance engineers before removing items |
| Inventory right-sizing | Slow-moving stock and repeat emergency buys of the same part | Review stocking policy by criticality and lead time | Never reduce stock on critical spares from price data alone |
Which KPIs Should You Track for MRO Spend?
Track KPIs that show whether control is improving, not only whether prices have fallen. Price results can reverse; control metrics explain why.
- Item duplication rate: the share of active items that have a duplicate or near-duplicate. It shows data health.
- Price variance against contract: paid price compared with agreed price. It shows leakage.
- Contract coverage: the share of MRO spend under a valid agreement or catalog. It shows control.
- Emergency order share: the proportion of purchase orders raised as urgent or after the fact. It shows planning quality.
- Supplier count per category: it shows fragmentation and negotiating leverage.
- Critical spare availability: it shows whether savings are being achieved safely.
What Do Different Industries Need to Consider?
The method is the same across industries, but the risk profile changes what you can safely do with the findings.
- Manufacturing. Multi-plant environments often hold overlapping spares under different item codes, making duplicate detection, item standardisation and price harmonisation especially important in manufacturing procurement.
- Oil and gas. Spares are often tied to equipment specifications, inspection requirements and long lead times, so standardisation must account for technical fit, criticality and availability in oil and gas procurement.
- Chemicals. Safety-rated and corrosion-resistant MRO items need attribute-level classification because a lower-cost alternative may not meet the required material, safety or process specification in chemical procurement.
- Pharmaceuticals. Approved suppliers, documentation requirements and audit trails can limit substitution, so compliance and qualification data should stay connected to the item record in pharmaceutical procurement.
- Power and utilities. Planned outage windows and breakdown maintenance strongly influence purchasing behaviour, making planned versus emergency demand an important MRO analysis dimension in power and utilities procurement.
SAFAL Insight: Analysis Finds Savings, Control Keeps Them
Most MRO analysis projects produce a convincing savings list and then lose the value in the following year. The reason is simple: the analysis changes nothing about how the next urgent requisition is raised. If a planner can still create a free-text line and a buyer can still choose any supplier, the fragmentation returns.
The durable answer is to connect insight to the buying process. Routine MRO items belong in contract-linked catalogs, approvals should follow clear value and category rules, and purchase orders should carry the right item, price and supplier from the start. Savings that are not embedded in the transaction flow are only estimates.
How Does SAFAL Support MRO Spend Analysis and Control?
Your ERP remains the system of record for items, suppliers and financial postings. SAFAL works as the system of orchestration around it. SAFAL's Spend Analytics draws data from Source-to-Pay modules and ERP transactions, and supports dashboards, price variance tracking against contracted rates, maverick and off-contract spend views, and savings tracking from identified to realised. For ERP data flows, SAFAL describes integrations and APIs covering SAP, Oracle, Microsoft Dynamics and Navision, including supplier, item and cost centre master data.
For the control side, Catalog Management supports contract-linked pricing enforcement and approval workflows, while Purchase Order Management carries approved requests through to the order. Supplier consolidation decisions can then be supported by supplier management records and performance data.
Conclusion
MRO spend analysis pays back when it is built on clean data, a taxonomy the business accepts and a clear view of criticality. Start with one high-volume category, such as bearings or electricals, prove the duplicate and price variance findings, and then extend the method to other categories and plants.
The final step matters most: move the findings into catalogs, contracts and approval rules so that the next purchase follows the new baseline.
Frequently Asked Questions

Ashish Patel
Ashish Patel is Head of Technology at SAFAL, with expertise in enterprise application architecture, solution design, software development, and procurement technology.